Showing posts with label frequent GC. Show all posts

Thursday, 23 August 2012

Identifying memory leaks using Eclipse MAT - Part 2


As I wrote in Part 1, we identified that there was some sort of memory leak happening within our Java JEE application – so the next steps were to obtain a Heap Dump and run it through Eclipse MAT.

So what is a Heap Dump? From the Eclipse docs

A heap dump is a snapshot of the memory of a Java process at a certain point of time. There are different formats for persisting this data, and depending on the format it may contain different pieces of information, but in general the snapshot contains information about the java objects and classes in the heap at the moment the snapshot was triggered.
The Memory Analyzer is able to work with HPROF binary heap dumps, IBM system dumps (after preprocessing them), and IBM portable heap dumps (PHD) from a variety of platforms.

Typical information which can be found in heap dumps (once more - depending on the heap dump type) is:

  • All Objects
Class, fields, primitive values and references
  • All Classes
Classloader, name, super class, static fields
  • Garbage Collection Roots
Objects defined to be reachable by the JVM
  • Thread Stacks and Local Variables

How do we get a heap dump into a .hprof file?

Set the following flags to the java process

·        -XX:+HeapDumpOnOutOfMemoryError writes heap dump on OutOfMemoryError

·        -XX:+HeapDumpOnCtrlBreak writes heap dump together with thread dump on CTRL+BREAK

Or you can fire one via tools jmap or jconsole

·        Sun JMap: <jdkhome>/bin/jmap  -dump:format=b,file=HeapDumpFilename.hprof


Our idea was to take multiple heap dumps every 2 hours or so and observe the objects in the heap. As with a thread dump, a heap dump is a static view of the live objects in the heap at that time – so it’s not possible to make a definitive judgment on just viewing one heap dump – hence space it out over some time and observe if the same objects (sometimes these have the same memory address location) are growing and causing a possible leak.

Also remember – at the point of taking a heap dump, Java runs a full GC, so you are left with the live objects in the heap.

We took the first heap dumps every 2 hours, but nothing much was happening for the first 12 hours or so.

Once you have the hprof with you, and have installed Eclipse Memory Analyzer Tool (MAT) just open the hprof in Eclipse and wait for it to do it’s thing.

The page will open with an Overview.

This lists important stuff like the Size of the heap – so in our case, though we have a 2 GB heap the retained size after GC is 473.1 MB.

The graph of “Biggest Objects by Retained Size” will give you immediate clues and this is also reflected in tabular format in the “Dominator Tree” report.


Overview


But the best thing about MAT is the Leak Suspects report which points out clearly potential memory leaks.


So in our hprof, 55% of the heap was being retained by one instance of weblogic.xml.query.xdbc.Context i.e. if this object was reclaimed by GC, we could get back 273 MB of memory. This object was residing at memory location weblogic.xml.query.xdbc.Context @ 0xb2477930
The important thing to see in this view is the Retained Heap
In Memory Analyzer the term shallow size means the size of an object itself, without counting and accumulating the size of other objects referenced from it.
The retained heap is the total objects and memory which this object is holding onto.


We took the next snapshot after 2 hours of the first heap dump and it showed the same instance of weblogic.xml.query.Context@0x7c1642f8 had now grown to 301.6 MB with the total heap now at 524.7 MB


Our last snapshot in confirming our problem was after a further 2 hours, so a total of 4 hours since the first heap dump showed this object.

The heap had now grown to 616.5 MB with 54% of it occupied by the same object
 
 
So next we now found out from MAT what was causing the leak. We next had to analyze how this class weblogic.xml.query.xdbc.Context  was being used in the app and how we could prevent the leak. I will post that in Part 3.

Saturday, 28 July 2012

JVM Heap analysis – Identifying memory leaks using Eclipse MAT


As part of the regular pre-Production testing it is common to conduct Performance tests for load under Peak and Soak conditions.

So we had this Weblogic platform on which all Peak tests were good and so also were the 12 hour Soak tests.

The JVM memory usage graph plotted showed regular GC clearing up memory and no obvious leaks. A simple graph plotted in Excel showing JVM Used Heap over time is shown below. It shows the pattern fairly close to an ideal sawtooth.


An additional test planned was an Extended Soak – mainly letting the system run as per expected normal volumes over 7 or 10 days to see if the JVM would throw up any unusual memory usage patterns or memory leaks.

And we came across some interesting issues !!

We did not have much of a problem for the first 24 and 48 hours – but after 48 hours (2 whole days) of continuous load, the graph showed that the JVM was unable to clear up any memory even after GC.


As the graphs above show the Weblogic server JVM inspite of multiple GCs was not reducing the utilized memory down to the usual 30 - 40% or so. It was staying at 80% or so until after 7 days the servers went OutOfMemory and just crashed.


So in order to analyze this we decided to take JVM Heap Dumps and analyze this using VisualVM or Eclipse MAT.

In this instance Eclipse MAT which is an easy Eclipse plugin gave an instant feedback and we were able to narrow down on Leak Suspects and actually find the root cause of the problem.

I will elaborate on that in Part 2 of this series.

Thursday, 6 August 2009

Weblogic JMS Performance Tuning Tips

Here are a couple of real-life tips on tuning JMS performance.

Problem:
The creates and sends JMS messages on an outgoing queue for consumption by another application.

It was observed that when the consuming application was offline for a period of time the number of messages that could be retained on the queue before the JVM heap was filled up was quite low. This was tested to be roughly 7000 messages, after which OutOfMemory exceptions begin to occur. Given that the consuming application could realistically be offline for a period, hence the use of an asynchronous queue, we needed to increase the number of messages that could realistically be stored in the queue.

The exception we get is shown below:


Start server side stack trace:
java.lang.OutOfMemoryError:

Start server side stack trace:
java.lang.OutOfMemoryError
<<no stack trace available>>
End server side stack trace
at weblogic.rmi.internal.BasicOutboundRequest.sendReceive(BasicOutboundRequest.java:109)
at weblogic.rmi.internal.BasicRemoteRef.invoke(BasicRemoteRef.java:127)
at weblogic.jms.dispatcher.DispatcherImpl_WLStub.dispatchSyncFuture(Unknown Source)
at weblogic.jms.dispatcher.DispatcherWrapperState.dispatchSync(DispatcherWrapperState.java:286)
at weblogic.jms.client.JMSSession.createProducer(JMSSession.java:1484)
at weblogic.jms.client.JMSSession.createSender(JMSSession.java:1335)
...


The GC logs also show frequent Full GCs before the server goes out of memory.


Solution Steps:


1. Enabling JMS Paging

Paging had not been enabled for the queue. Despite this queue being persistent, this meant that every message was stored in the JVM memory heap in its entirety. Enabling message paging for this queue means that only the headers for paged messages are kept in memory, significantly reducing the amount heap utilized.

As the messages were being persisted via a JDBCStore to a database, this functioned as a paging store as well, however a FileStore must still be specified as the paging store for the JMS Server, or the JMS Server will not deploy at WLS server start time. This would be due to the need to cater for any non-persistent destinations when paging is enabled. If non-persistent messages are not paged, the size of this FileStore will be negligible. Paged messages still occupy some space on the memory heap as the message headers are still kept in memory.

On enabling paging for the specific queue, the test could cater for roughly 15000 messages before OutOfMemory exceptions occurred. The point at which paging began was set deliberately low to 100. Recovering from the page store does incur a certain performance cost, so in Production this was set to a more reasonable number based on the peak number of messages expected in the queue under normal conditions.

Despite the gain in number of messages that could be catered for, the heap utilisation graphs were very similar to those before paging was enabled. This showed no minor GCs, only full GCs at fairly frequent intervals.


2. JVM Settings and Garbage Collection Tuning

The untuned JVM heap size was 512Mb. This value could be increased, but test results after tuning the JVM settings indicate that this was probably more than adequate.

Examining the current JVM settings uncovered some settings that needed to be changed.

The most significant issue with the JVM settings was the NewSize value. This was set very high to 384Mb out of the total heap of 512 Mb.
A reasonable New Generation area would normally be 20-25% of the total heap size and setting it larger than the Tenured Generation area is guaranteed to cause unhealthy GC operations. In addition, it is good practice to use NewRatio rather than NewSize to avoid fixing an absolute size. A NewRatio of 3 (1:3, i.e. 25% of heap) or 4 is considered the most appropriate for WebLogic Server applications. NewSize was therefore dropped and a NewRatio was set to 4 (20% of total heap).

The SurvivorRatio value was set to a reasonable value of 3.
TargetSurvivorRatio, however, was unset meaning that the default of 50 applies. 80 would probably be a better setting, meaning that the switch between survivor spaces in the JVM heap would occur at 80% rather than 50%. The performance improvement from this should be noticeable in the frequency of minor GC, though not dramatic.

The PermSize values were high, with PermSize and MaxPermSize both set to 384Mb. These were reduced to 64Mb and 128Mb respectively, which should be more than adequate. Though these changes are unlikely to improve performance, having the PermSize set to high will needlessly consume memory.

The effect of setting a good NewRatio value was dramatic. Many minor GCs were the rule, with infrequent full GCs. 60,000 messages were added to the queue before the heap was approaching full. We ran an overnight, and somewhere between 60,000 and 70,000 messages the OutOfMemory exceptions occurred.

Scaling this up to the Production environment which has 1Gb Heap, shows that the server could easily cater for the expected load.

Monday, 13 July 2009

JVM Tuning from the Trenches

This article is a follow-up to http://jojovedder.blogspot.com/2009/06/slow-weblogic-part-6-jvm-heap-analysis.html. Please read that one first for the basics on JVM heap, parameters and flags.

Also remember these tips have worked for the server settings and issues faced below, but blindly using these on your server will not produce the same results. You have to measure and then tune after measuring.

Problem:
Platform running Weblogic 8.1 on Sun V880 servers. Total RAM of 32 Gb on the machine.
2 Gb assigned to the managed server JVM heap. JDK 1.4

Initial settings:
-XX:+AggressiveHeap -Xms2048m -Xmx2048m  -XX:SurvivorRatio=32 -XX:MaxPermSize=128m 


But still there are 20 Full GCs per hour in peak times, before the server crashes.


Analysis

1. It was decided to reduce the SurvivorRatio to 4 and restart with some more flags.

The size of ONE Survivor Space is calculated as

SurvivorSpace = NewSize / (SurvivorRatio + 2)

Keeping SurvivorRatio as 32 means the Survivor spaces are too small for promoting stuff from Eden. Hence we reduce this to 4 which allows for larger Survivor spaces.

2. As per Sun Bug ID: 6218833, setting AggressiveHeap set before Heapsize (Xmx and Xms) can confuse the JVM. Revert the order to have -Xms and -Xmx to come before -XX:+AggressiveHeap or not use it

3. The application has 180+ EJBs with pools of beans. Hence set the -Dsun.rmi.dgc.client.gcInterval=3600000 (1 hour) instead of the default 60000 (1 min). More on this here: http://docs.sun.com/source/817-2180-10/pt_chap5.html

4. The site is restarted once a week at 4:30AM. The patterns stays normal for 2 days – and then degrades into full GC.

5. The Old space is pretty much full – at every minor collection – the Old space must be cleared up for promotion from Young to Old to take place.

6. Permanent space is pretty much full – keeps loading classes and classes ( could that be a problem – the difference between the number of JSP’s per Release?)
Hence we increased the PermSpace from 128M to 256M

7. Ensure we are running the server JVM by using the -server flag

8. Use OptimizeIt or similar profiling tool to see the memory usage and find code bottlenecks.


The settings now were

-server -Xms2048m -Xmx2048m  -XX:MaxNewSize=512m -XX:NewSize=512m -XX:SurvivorRatio=4 -XX:MaxPermSize=256m -Xincgc -XX:+DisableExplicitGC -XX:+AggressiveHeap -XX:-OmitStackTraceInFastThrow


This reduced the Full GCs to one a day.

Error Logs

At the time of the server going out of memory prior to a crash, the logs are filled with repeated errors (up to 100 repetitions) of this sort

java.lang.NullPointerException
 <<no stack trace available>>


Adding the -XX:-OmitStackTraceInFastThrow flag resolves this problem, the root cause of the NPE it self has to be tracked down but we do not have any longer the issue of huge recursive exception strings.

We could now see the stack trace as

java.lang.NullPointerException
 at java.util.StringTokenizer.(StringTokenizer.java:117)
 at java.util.StringTokenizer.(StringTokenizer.java:133)
 at jsp_servlet._framework._security.__login._jspService(login.jsp:294)
 at weblogic.servlet.jsp.JspBase.service(JspBase.java:27)
 at weblogic.servlet.internal.ServletStubImpl$ServletInvocationAction.run(ServletStubImpl.java:1075)


This seems to be a Sun bug described here.

Monday, 15 June 2009

Slow Weblogic Part 6 - JVM Heap Analysis using GCViewer

Basics


In an earlier article, I had listed the review of JVM memory parameters as one of the important checks for tuning the JEE server platform.

The basic primer for JDK 1.4 is at http://java.sun.com/docs/hotspot/gc1.4.2/


The key points you need to know are:

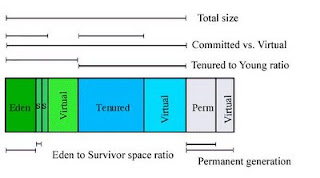
Total JVM Heap = Young + Tenured(also called Old)


Young = Eden + From (SS1) + To (SS2)


In the diagram below [taken from the Sun website], "From" and "To" are the names of the two Survivor Spaces (SS) within the "Young".

Perm Space (and code cache): stores JVM’s own stuff. This is outside the Heap you assign using Xms and Xmx. A good explanation of this is available here

The JVM Heap is at default initial 2Mb and max 64Mb (for JDK 1.4 on Solaris).
Default Perm Size is 16MB (for JDK 1.4 on Solaris)
The defaults change for each JDK and are different on each OS - so look up the values on the respective websites.


The ratios are as shown below


Now the object life cycle and garbage collection occurs like this:

1. Objects when created are always first allocated to Eden.
2. When Eden fills up, a fast but not comprehensive GC (minor collection) is run over the young generation only.
3. All surviving objects are moved from Eden into one Survivor Space.
4. In consequent minor collections, new objects move from Eden into the other Survivor Space, plus everything from the first Survivor Space (survivors from the previous minor collection) is also moved into the second Survivor Space. Thus one survivor should be empty at that time.
5. When objects in Survivor Space are old enough (or survivor fills up), they are moved to Tenured. By default the long-lived objects may be copied up to 31 times between the Survivor Spaces before they are finally promoted to the Old generation.
6. When tenured fills up, a Full GC collection is run that is comprehensive: the entire heap is analyzed, all objects that can be destroyed are killed and memory is reclaimed.

Note: the above lifecycle changes slightly when advanced options such as ConcurrentMarkSweep etc are enabled.

Look Closer

What do these values mean ?

A full list of options available at http://java.sun.com/docs/hotspot/VMOptions.html and http://java.sun.com/javase/technologies/hotspot/vmoptions.jsp


The absolute basic ones are listed in the table below. Note: This is for JDK 1.4
Some of these have changed in JDK 1.6


-Xms1536m -Xmx1536mThese represent the total heap (minus Perm space). Xms is the Initial Heap, set to 1.5Gb in this case. Xmx is Max Heap. It is good practice to set Xms = Xmx
The max heap is limited by the RAM available on the server
-XX:NewSize=512m This specifies the initial size of the Young generation,set to 512Mbin this example. It is better to set this as a percentage of the Heap using -XX:NewRatio
-XX:MaxNewSize=512mThis specifies the maximum size of the Young generation,set to 512Mbin this example. It is better to set this as a percentage of the Heap using -XX:MaxNewRatio
-XX:PermSize=64m -XX:MaxPermSize=128mThese values are the Minimum and Maximum sizes of the permanent generation heap space. Optimally, set PermSize equal to MaxPermSize to avoid heap having to be adjusted when permanent area grows. As specified earlier, this area of memory is over and above the Total Heap set using Xms
-XX:SurvivorRatio=8 -XX:TargetSurvivorRatio=90The New generation area is divided into three sub-areas: Eden, and two survivor spaces that are equal in size. Use the -XX:SurvivorRatio=X option to configure the ratio of the Eden/survivor space size. In the above example, setting it to 8 means the ratio of Eden:SS1:SS2 is 8:1:1. So for a NewSize of 512 Mb, the two SS will be 51 Mb each, and Eden will be 512 MINUS (51 + 51) = 410 Mb.
TargetSurvivorRatio of 90 allows 90% of the survivor spaces to be occupied instead of the default 50%, allowing better utilization of the survivor space memory.
-XX:MaxTenuringThreshold=10This switch determines how many times the objects are hopped between the Survivor spaces before getting promoted to the older generation. The default value is 31.
-XX:+DisableExplicitGC
-XX:+PrintGCDetails -XX:+PrintGCTimeStamps -XX:+PrintTenuringDistribution -XX:+PrintGCApplicationConcurrentTime -XX:+PrintGCApplicationStoppedTime -Xloggc:/log/gc.log
These are GC specific settings asking for GC details and the log file name in which these details should be captured


If you have an appetite for more, read this http://java.sun.com/performance/reference/whitepapers/tuning.html

GCViewer

This link below explains how to download and use the GCViewer tool. This is quite a useful tool for viewing the number of GCs and Full GCs and how the JVMis behaving over time.

http://www.javaperformancetuning.com/tools/gcviewer/index.shtml

The most important things to look at in the GCViewer analysis are the

* Acc Pauses - Accumulated Pause Time (total time app was stopped for GC).Pauses are the times when an application appears unresponsive because garbage collection is occurring
* Total Time - Total Time the application runs.
* Throughput - Time the application runs and is not busy with GC. Greater than 99% is fantastic.Throughput is the percentage of total time not spent in garbage collection, considered over long periods of time.
* Footprint - Overall Memory Consumption - Ideally as low as possible. This is the working set of a process, measured in pages and cache lines. On systems with limited physical memory or many processes, footprint may dictate scalability. Thus this usually reflects the size of total Heap allocated via Xms and Xmx

This diagram is taken from the above site:


Tuning Example From the Trenches - Frequent GC due to Perm Space getting Full

JVM Parameters already set

java -server -Xms1024m -Xmx1024m -XX:MaxPermSize=340m -XX:NewSize=340m -XX:MaxNewSize=340m
-XX:SurvivorRatio=9 -XX:TargetSurvivorRatio=90 -XX:+UseParNewGC
-Xloggc:/wls_domains/gclog/jms.gc -XX:+PrintGCDetails -XX:+UseParNewGC
-XX:+PrintGCTimeStamps -XX:+DisableExplicitGC -XX:+PrintTenuringDistribution
-XX:+PrintGCApplicationConcurrentTime -XX:+PrintGCApplicationStoppedTime
-XX:+JavaMonitorsInStackTrace -Dweblogic.system.BootIdentityFile=/wls_domains/xx/boot.properties
-Dweblogic.management.server=http://xx.xx.xx.xx:6000 -Dweblogic.Name=xxxxxx
-Dweblogic.ProductionModeEnabled=true
-Djava.security.policy=/opt/bea/wls/8.1sp4/weblogic81/server/lib/weblogic.policy
weblogic.Server


Full GC Pattern

The GC log shows


0.000: [Full GC 0.000: [Tenured: 0K->9794K(700416K), 0.8050952 secs] 134607K->9794K(1016960K), [Perm
: 20479K->20479K(20480K)], 0.8053527 secs]


First Full GC happens at 0:00 sec from start of server. Before and after '->' figures represent size of live objects before and after GC. Number in parenthesis indicates total available space. So from above numbers - Tenured was not full but Perm was almost full.


6579.013: [Full GC 6579.013: [Tenured: 9794K->18941K(700416K), 0.9677233 secs]
155600K->18941K(1016960K), [Perm : 24575K->24575K(24576K)], 0.9679896 secs]


Same thing happens here. The second Full GC took place at 6579.013 sec (1hr 49mins) from startup of server.
Again a Full GC is triggered, but the Tenured was not full. The Tenured is now 18.9 Mb out of 700 Mb - but it is seen the Perm Space has grown to 24.5 Mb and is not getting cleared.


9363.515: [Full GC 9363.516: [Tenured: 18941K->19463K(700416K), 0.6532332 secs] 36950K->19463K(1016960K), [Perm : 28672K->26462K(28672K)], 0.6536095 secs]


At the 3rd Full GC at 9363 seconds after server startup, the Perm space grew to 28.6 Mb and recovered marginally to 26.4 Mb.

Observing this over a long period of time, we concluded that at startup around 20MB is allocated to perm which with each Full GC keeps growing till 30MB and later shrinks back to 25MB and the cycle continues.

The pattern is highlighted below:


0.000: [Full GC 0.000: [Tenured: 0K->9794K(700416K), 0.8050952 secs] 134607K->9794K(1016960K), [Perm : 20479K->20479K(20480K)], 0.8053527 secs]
6579.013: [Full GC 6579.013: [Tenured: 9794K->18941K(700416K), 0.9677233 secs] 155600K->18941K(1016960K), [Perm : 24575K->24575K(24576K)], 0.9679896 secs]
9363.515: [Full GC 9363.516: [Tenured: 18941K->19463K(700416K), 0.6532332 secs] 36950K->19463K(1016960K), [Perm : 28672K->26462K(28672K)], 0.6536095 secs]
13483.233: [Full GC 13483.233: [Tenured: 19463K->16962K(700416K), 0.9783693 secs] 26678K->16962K(1016960K), [Perm : 30719K->21330K(30720K)], 0.9857390 secs]
17308.829: [Full GC 17308.830: [Tenured: 16962K->17312K(700416K), 1.0578872 secs] 88025K->17312K(1016960K), [Perm : 25600K->25600K(25600K)], 1.0581738 secs]
21237.810: [Full GC 21237.810: [Tenured: 17312K->17814K(700416K), 1.4728764 secs] 302290K->17814K(1016960K), [Perm : 29695K->26719K(29696K)], 1.4801234 secs]
30079.672: [Full GC 30079.672: [Tenured: 17814K->18676K(700416K), 1.0282446 secs] 83159K->18676K(1016960K), [Perm : 30975K->27564K(30976K)], 1.0349869 secs]


Solution:
Though the MaxPermSize=340m is provided, initial available Perm Size is getting full and JVM is invoking a Full GC to free up memory. The default initial PermSize is 16Mb and hence the Perm Space is resizing itself as the JVM grows.

Not sure if this behaviour is a bug but by adding an initial PermSize of 64K using this flag -XX:PermSize=64m resolved this issue of frequent Full GC.


UPDATE: Another examples published on http://jojovedder.blogspot.com/2009/07/jvm-tuning-from-trenches.html

The cost of legacy technical debt and the need for modernization

 Legacy systems, once the backbone of enterprise IT, are now a major obstacle to innovation, agility, and resilience. Despite the rise of cl...